Electricity Demand Forecasting: Predict Power Loads with Machine Learning

Most forecasting tutorials use clean, simple datasets that never prepare you for real production data. This tutorial is different, it walks through two real applied problems using actual public electricity grid data from the United States, the kind of large-scale, high-frequency data you would encounter forecasting demand for a utility company, a factory, or any operation where electricity costs scale with usage.
In Part 1 you will start with a real cost-saving use case: predicting demand peaks. In many electricity markets, consuming power at the wrong moment triggers significantly higher tariffs, so being able to forecast exactly when those peaks will occur has direct financial value. You will build a LightGBM forecasting model, run cross validation across multiple historical windows, and use the forecasts to detect predicted peak demand periods.
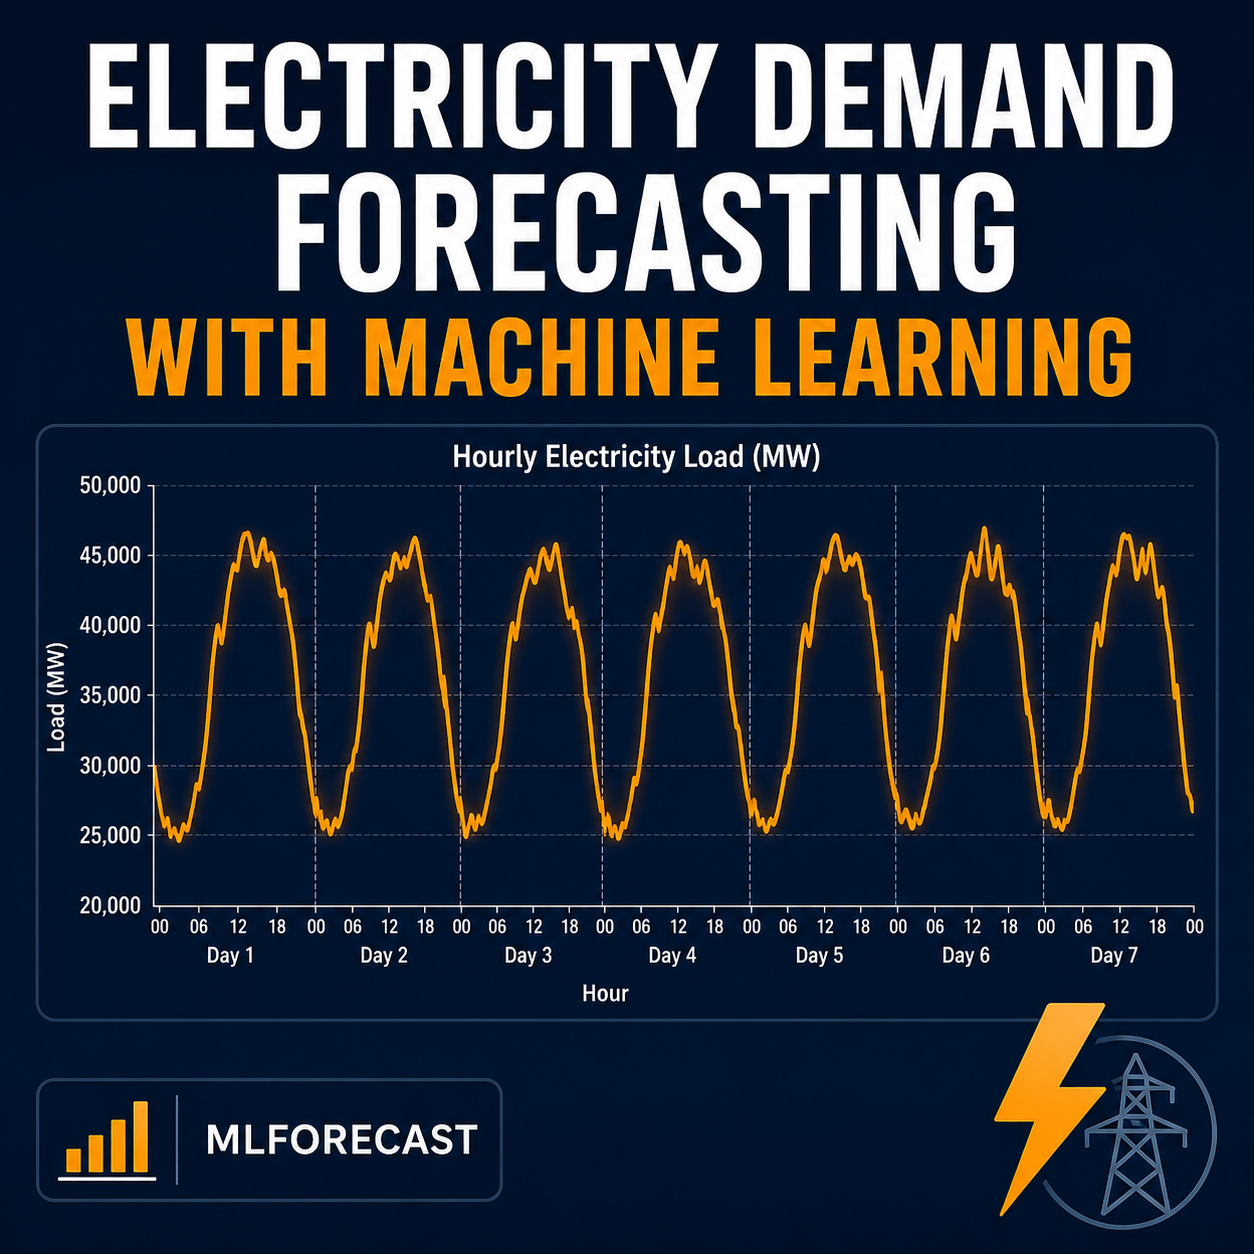
In Part 2 you will go deeper, working with hourly electricity load data and learning how to handle multiple seasonalities, the kind of overlapping daily and weekly patterns that make time series forecasting genuinely difficult, using MLForecast, a fast and production ready forecasting library built on familiar machine learning models.
By the end of this tutorial you will have:
- Learned how to structure time series data the way MLForecast expects it
- Trained a LightGBM model for short-term demand forecasting
- Used cross validation to test forecasts across multiple historical windows
- Applied your forecasts to a real business problem, detecting and predicting demand peaks
- Explored and visualized multiple seasonalities in hourly electricity data
- Applied differencing transformations to stabilize a time series
- Built a more advanced forecasting pipeline using MLForecast
Basic Python and pandas knowledge is recommended before starting this tutorial. Everything runs in a standard Python environment, no specialized infrastructure required.
This is not a course about theory. It is about working through real forecasting problems the way they actually show up in industry.