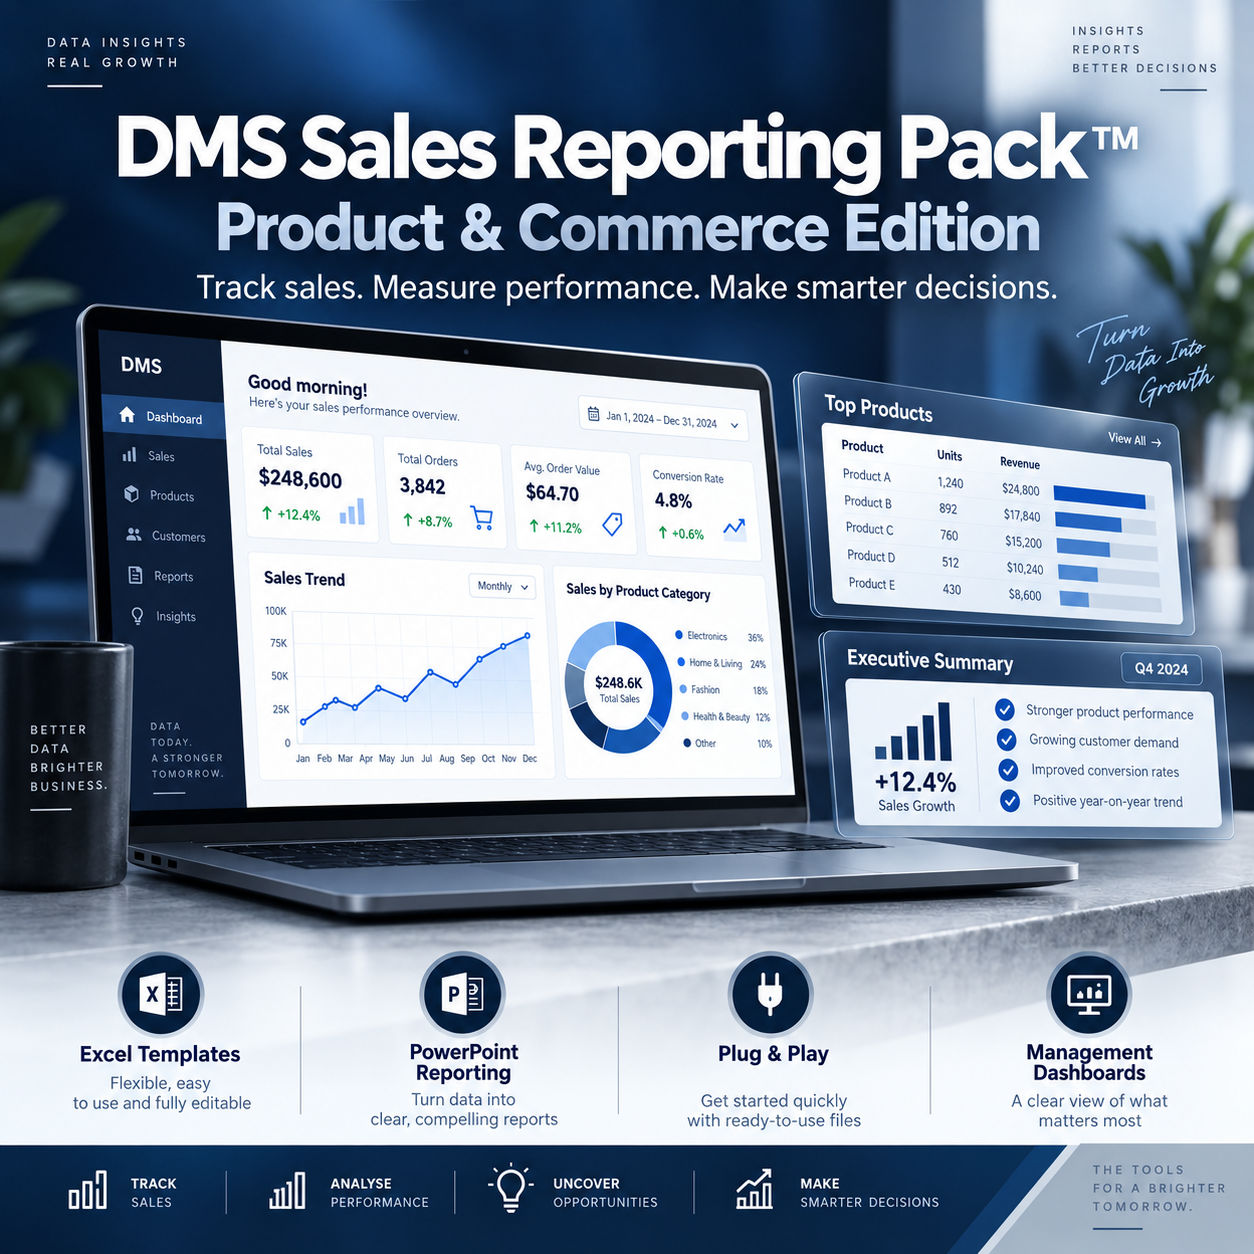
DMS Sales Reporting Pack™ — Product & Commerce Edition
Your sales team should not only report numbers — they should explain the market behind the numbers.
FULL DESCRIPTION
Sales are growing — but can you clearly explain what is driving the growth, which products are moving, which stores or customers are slowing down, where cash is stuck, what competitors are doing, and what management should do next?
The DMS Sales Reporting Pack™ — Product & Commerce Edition was built for businesses that sell physical products through B2B, retail/distribution, direct-to-consumer and e-commerce channels.
It gives your sales or commercial team a complete reporting structure from the daily sales snapshot through the annual commercial performance review. Instead of presenting disconnected numbers, the reports connect performance to products, customers, stores, pipeline, availability, receivables, returns, complaints, competitive activity, risks and management actions.
You do not need to be a PowerPoint expert. Every chart is editable inside PowerPoint: right-click the chart, select Edit Data, replace the sample figures with your own numbers, and the visual updates automatically.
WHAT YOU RECEIVE
• DMS-SALES-RPT-001 — Daily Sales & Order Snapshot
• DMS-SALES-RPT-002 — Weekly Sales Executive Dashboard
• DMS-SALES-RPT-003 — Monthly Sales & Commercial Performance Report
• DMS-SALES-RPT-004 — Quarterly Sales Business Review
• DMS-SALES-RPT-005 — Mid-Year Sales Review & H2 Reset
• DMS-SALES-RPT-006 — Annual Sales Planning & Budget Pack
• DMS-SALES-RPT-007 — Annual Sales & Commercial Performance Report
• Sales Reporting Pack User & Execution Guide
• Editable sample data and native PowerPoint charts
WHAT THIS HELPS YOU SEE
Revenue & growth • products/SKUs • stores/customers • B2B pipeline • B2C/e-commerce • receivables • sales execution • complaints/returns • competitive/store intelligence • management decisions.
WHO IT IS FOR
Founders, CEOs, Sales Managers, Commercial Managers, Key Account Managers, distributors, manufacturers and e-commerce teams selling physical products.
DO NOT BUY THIS IF
• You only need a basic sales tracker.
• You do not intend to review performance or assign action owners.
• You need an ERP/CRM replacement.
• You expect a template to make commercial decisions without reviewing the data.
HOW IT WORKS
1. Choose the report cadence.
2. Replace the illustrative sample data.
3. Right-click PowerPoint charts → Edit Data → replace figures.
4. Update the management insight and recommendation.
5. Present and assign owner + deadline.
Stop reporting sales as a number. Start reporting sales as a business story.
Get the DMS Sales Reporting Pack™ and give your sales team a clearer, faster and more professional way to show management what is selling, what is changing, where the risks are and what should happen next.