GlobalMart Power BI Executive Dashboard Toolkit + 4 Retail Datasets & DAX Cheat Sheet

A regional sales manager used to spend 4 hours every Monday manually merging five territory Excel spreadsheets and fixing broken VLOOKUPs. With a clean Star Schema and automated DAX measures, that entire weekly reporting routine finishes in 10 minutes.
Most people learning Power BI practice on clean, 10-row sample spreadsheets that never show up in real workplaces. Then they sit in a live technical interview or get handed messy company exports and struggle to connect tables, calculate year-over-year trends, or build executive-ready KPIs.
Created by Hasbal Global Solutions (hasbal.com.ng), the GlobalMart Power BI Executive Dashboard Toolkit gives you raw multi-table retail data, an interactive executive dashboard simulator, and a copy-paste DAX & Power Query formula cheat sheet so you can reverse-engineer and build a boardroom-ready portfolio project immediately.
What You Get Inside Your Instant Download
- 4 Raw GlobalMart Retail Datasets (2,500+ Relational Records):
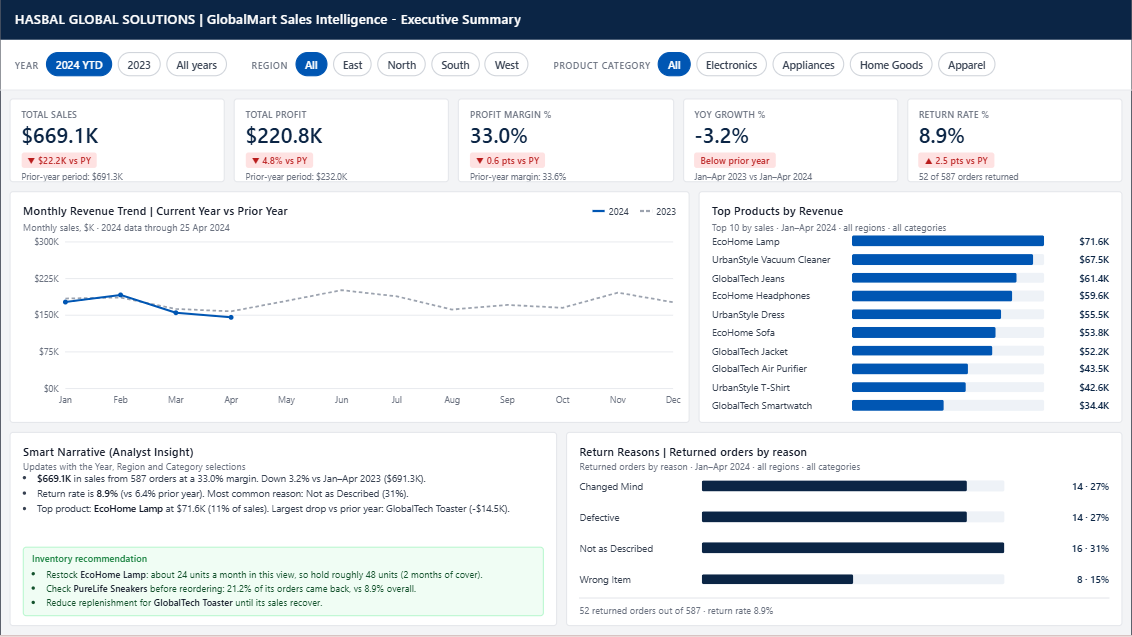
GlobalMart_Sales_Data.csv: 2,500 transactional order records spanning 2023 and 2024 with quantities, unit prices, discounts, and order IDs.GlobalMart_Products.xlsx: Complete product master catalog across Electronics, Appliances, Apparel, and Home Goods with unit cost mappings.GlobalMart_Customers.csv: 200 multi-region customer demographic profiles (North,South,East,West) acrossCorporate,Consumer, andHome Officesegments.GlobalMart_Returns.csv: 200 returned order logs with timestamps and return reasons (Not as Described,Defective,Changed Mind,Wrong Item) for return-rate modeling.- Interactive GlobalMart Executive Dashboard Simulator (HTML/Web App):
- Open directly in any browser with zero setup to test live Year (
2024 YTD,2023,All Years), Region, and Product Category slicers. - Inspect real-time recalculations across Total Sales (
$669.1KYTD), Total Profit ($220.8K), Profit Margin (33.0%), YoY Growth, and Return Rate (8.9%), plus dynamic Smart Narrative inventory recommendations. - 2-Page DAX & Power Query Quick-Reference Cheat Sheet (PDF):
- Ready-to-paste DAX patterns for
CALCULATE,TOTALYTD,SAMEPERIODLASTYEAR,RANKX, custom DAX Date tables, and Power Query unpivot/merge steps. - Star Schema Architecture Blueprint (PNG):
- Visual data model map showing exact
1:*single-direction relationships between your Sales fact table and dimension tables.
Who This Toolkit Is Built For
- Job Seekers & Aspiring Data Analysts: Build an end-to-end retail Business Intelligence project for your CV, GitHub, or LinkedIn portfolio this weekend.
- Microsoft PL-300 Exam Candidates: Practice real Star Schema modeling, DAX Time Intelligence, and KPI storytelling tested on the certification exam.
- Finance, Operations & Sales Staff: Adapt the executive KPI layout and DAX formulas directly to your workplace reporting.
About Hasbal Global Solutions
Built by Azeez Ajibola Azeez, Founder and Lead Data Consultant at Hasbal Global Solutions (hasbal.com.ng). Holding credentials from Microsoft and DataCamp, Azeez builds automated reporting pipelines tracking over $20M in transactional spend and has trained more than 100 professionals across 15+ countries.
(Looking for the companion 56-page step-by-step study manual and PL-300 practice exam book? Search Power BI Masterclass: From Data Chaos to Executive Dashboards on Amazon Kindle or follow the direct link inside your toolkit's README file.)