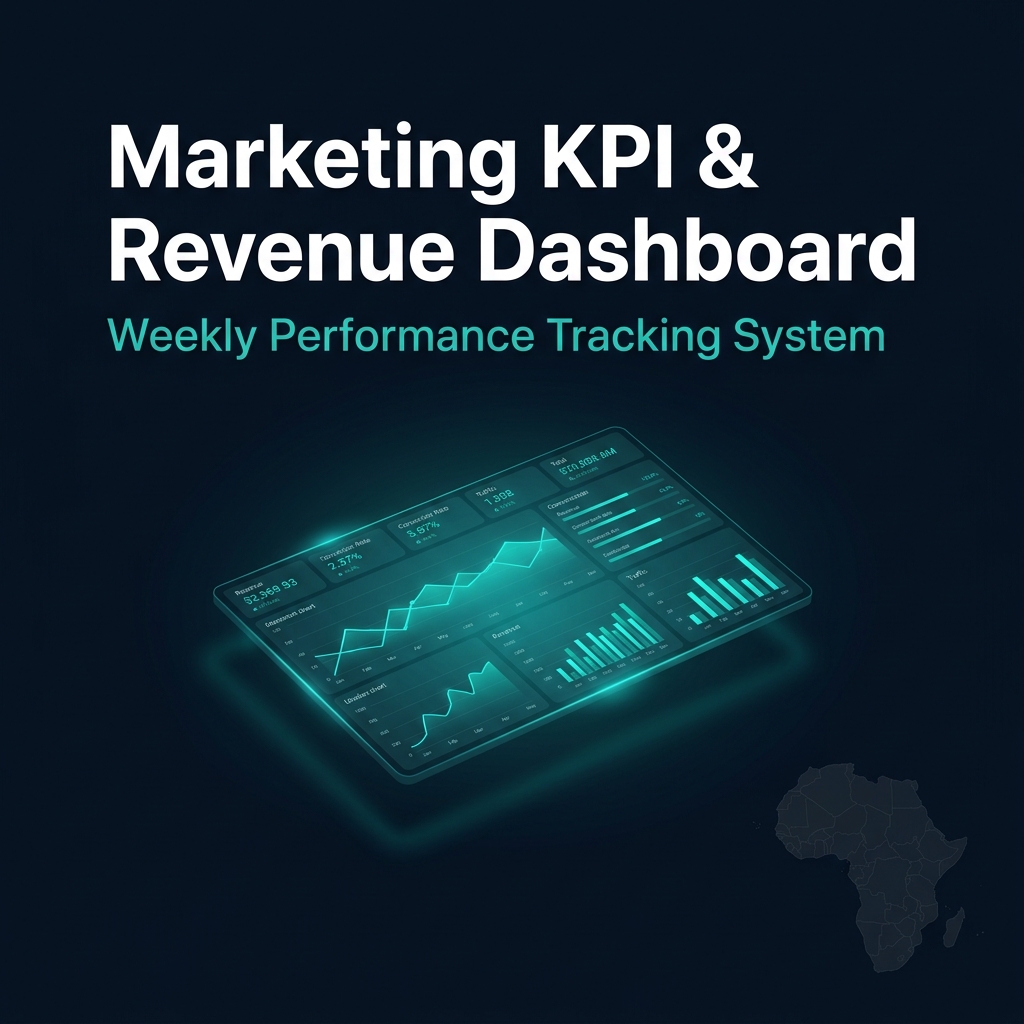
Marketing KPI & Revenue Dashboard — Weekly Performance Tracking System
Marketing KPI & Revenue Dashboard — Weekly Performance Tracking System
You run campaigns. You spend budget. But at the end of every week, can you walk into a board meeting and confidently answer: "Which channel is actually driving revenue — and what should we do differently next week?"
Most marketing teams can't. Not because the data doesn't exist — but because nobody has built the system to turn that data into decisions.
This prompt fixes that. Paste it into Claude Sonnet, fill in your business details, and within minutes you have a fully structured marketing performance dashboard — built for your sector, your market, and your reporting audience.
It covers every KPI that matters: CAC, LTV, ROAS, Churn, Conversion Rate, and more — each with its formula, an African or international market benchmark, a traffic-light status, and a recommended action if you're in the red. It also builds a channel attribution model, a weekly data-collection routine, and a one-page board report template you can send straight to investors or clients.
What you get — 8 key benefits
Instant decision-making with a traffic-light system
Every KPI is tagged Green, Amber, or Red — so you stop wasting time interpreting data and start acting on it. No more guessing whether your numbers are good or bad.
Built for African and international markets
Industry benchmarks are included per KPI for Ghana, Nigeria, and other African markets — not just US/EU averages that don't reflect your reality. Finally, a dashboard that speaks your market's language.
Know exactly which channel earns your money
The built-in first-touch, last-touch, and linear attribution model ends the debate. Stop funding channels based on gut feeling — fund them based on evidence.
Board and investor-ready reports in minutes
A pre-formatted one-page monthly board summary template is included. Turn your raw weekly data into a polished executive report without hiring a data analyst.
10 critical KPIs covered with formulas and actions
CAC, LTV, LTV:CAC Ratio, Conversion Rate, ROAS, Churn Rate, Email Open Rate, CTR, Lead-to-Close Rate, and MoM Revenue Growth — each with a formula, benchmark, and fix if it's underperforming.
A weekly data routine you'll actually follow
The prompt outputs a structured weekly collection checklist — what to pull, where to pull it from, and how long it takes. Consistency is the foundation of great reporting.
Works for any business type or channel mix
Whether you run Meta Ads, WhatsApp campaigns, SEO, or email — and whether you're an e-commerce brand, SaaS company, agency, or retailer — the prompt adapts to your setup via simple bracket inputs.
Reusable every single month
This is not a one-time template. Re-run the prompt monthly with fresh data and Claude Sonnet will generate updated analysis, revised benchmarks, and new recommended actions each time.
Who needs this
Marketing managers
CMOs & VPs of marketing
Agency owners
Startup founders
Investor-backed teams
Client-facing account leads
How to use this product
1 Purchase and download — You receive the full prompt as a digital file immediately after checkout.
2 Go to claude.ai — Open a new chat and select Claude Sonnet as your model (free or Pro account).
3 Copy and paste — Paste the full prompt into the chat window. No plugin, no software install needed.
4 Fill in the brackets — Replace each [field] with your business type, channels, country, and reporting audience.
5 Run and refine — Claude builds your dashboard instantly. Ask it to adjust any section, add a KPI, or reformat for a specific audience.
6 Repeat monthly — Update your numbers, re-run the prompt, and keep your reporting sharp all year round.
Affiliate & coupon details
Earn 40% commission on every sale
Join the affiliate program on Selar and earn 40% of every sale you refer. Buyers also get a 10% discount coupon — making it easy to convert your audience. Share your unique link on WhatsApp, Instagram, LinkedIn, or email. No technical setup required.
Common questions answered
Do I need to know how to code or use spreadsheets?
No. The prompt runs entirely inside Claude Sonnet at claude.ai. You type, Claude builds. No Excel, no Python, no technical skills required.
What AI tool do I need?
Claude Sonnet, available free at claude.ai. A Claude Pro account ($20/month) gives you higher usage limits, but the free tier works for most users.
Is this relevant outside Ghana and Nigeria?
Yes. The prompt accepts any country or region. African market benchmarks are a built-in bonus — not a limitation.
Can I use this for client reporting as an agency?
Absolutely. Agency owners are one of the primary use cases. Run a separate dashboard instance per client by filling in different bracket inputs each time.
Is this a one-time purchase?
Yes — one payment, lifetime access to the prompt file. Re-run it as many times as you like with no additional cost.
What if the output isn't exactly what I need?
Just ask Claude to revise it. You can request more KPIs, a different tone, a different format, or a version tailored to a specific investor. The prompt is a starting engine, not a fixed output.