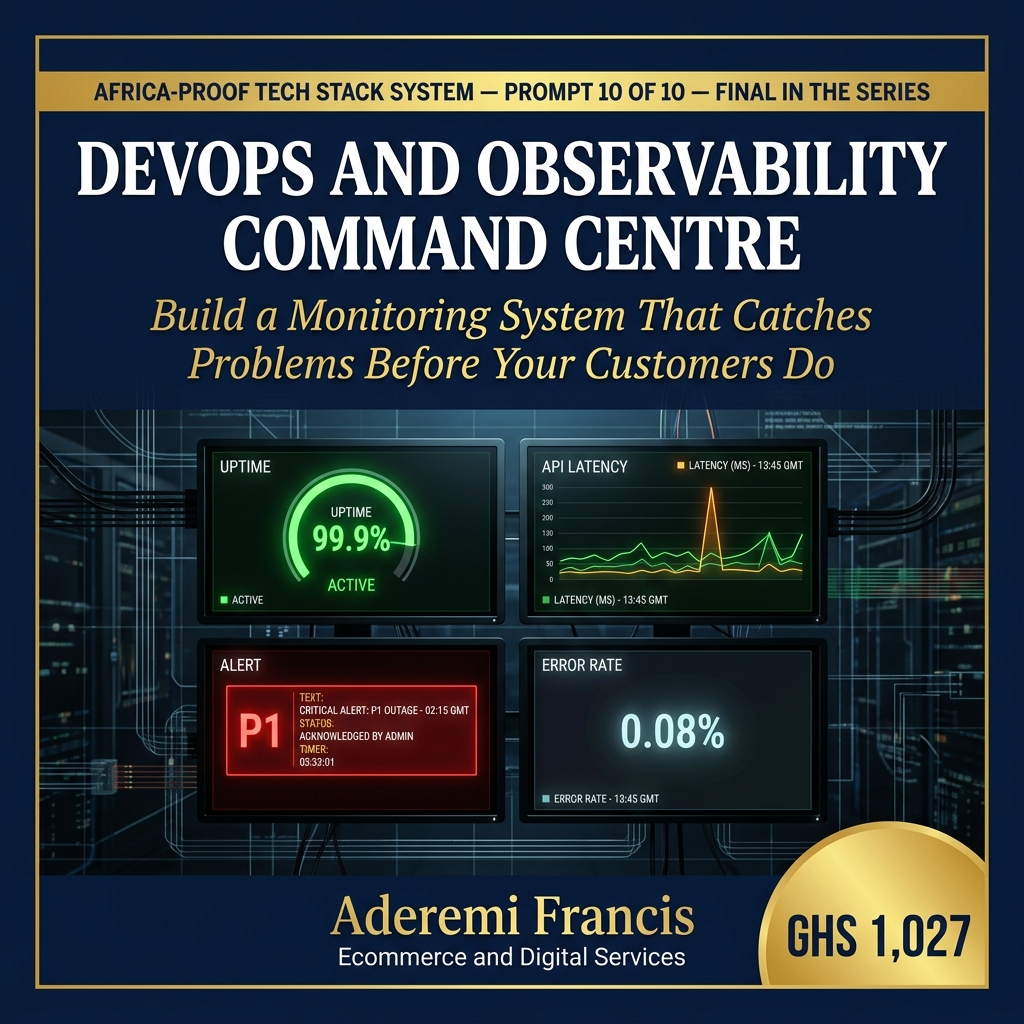
The DevOps and Observability Command Centre Prompt — Build a Monitoring System That Catches Problems Before Your Customers Do
The AI prompt that designs a complete, production-grade monitoring and observability framework for your technology systems — with uptime targets, alert protocols, escalation playbooks, and dashboard structures your engineering team can deploy immediately.
YOUR CUSTOMERS SHOULD NEVER BE THE FIRST TO KNOW YOUR SYSTEM IS DOWN
But for most African technology companies right now, that is exactly what happens.
A payment fails. A user posts on Twitter. Your customer support inbox fills up. Your phone rings. And somewhere in your engineering team, someone opens a laptop, pulls up a dashboard that has not been configured properly, and begins the most stressful, most expensive, and most avoidable process in all of technology — reactive incident response.
You are finding out about your own system failure through your customers. And you are paying for that delay in lost revenue, eroded trust, and engineering time that should have been spent building, not firefighting.
The organisations that consistently deliver exceptional digital experiences are not more technically gifted than yours. They are simply more observable. They know what is happening in their systems before their customers do — and they have a documented, tested protocol for responding the moment something begins to go wrong.
This prompt builds that capability for your organisation in minutes.
WHAT DOWNTIME IS COSTING DIGITAL BUSINESSES IN 2025
The State of Resilience 2025 report, which surveyed 1,000 senior technology executives worldwide, produced a finding that should be on the desk of every CTO and engineering manager in Africa: 100 percent of the organisations surveyed reported experiencing outage-related revenue losses in the past year. Every single one. One-third reported per-outage revenue losses ranging from $100,000 to over $1,000,000. And the organisations surveyed reported experiencing an average of 86 outages annually — meaning outages are not exceptional events. They are a routine operational reality for any company running digital systems without a proper observability framework.
According to Uptime Institute's 2025 Annual Outage Analysis, 54 percent of major outages cost more than $100,000, and nearly one in five cost more than $1 million. For e-commerce businesses, Gartner research documents losses of $50,000 to $100,000 per hour during an outage. For financial services companies, enterprise-level system failures cost an average of $300,000 per hour when applications go offline.
In the fintech sector specifically — one of Africa's fastest-growing and most competitive industries — API downtime increased by 60 percent between Q1 2024 and Q1 2025. Financial services firms now face measurable losses averaging over $150 million annually from critical system outages, with revenue streams taking up to 75 days to fully recover after a major incident.
For African fintechs, e-commerce platforms, health tech companies, and SaaS businesses, these numbers are not abstract. Every minute your payment gateway is down, transactions are failing. Every hour your platform is unreachable, customers are forming permanent impressions of your reliability. Every incident resolved reactively rather than proactively is an incident that costs two to three times more in engineering time, customer relations repair, and reputation recovery than it would have cost to detect and prevent.
Downtime costs for companies with frequent outages are up to 16 times higher than for companies with fewer instances — because unreliable systems compound. Every unresolved incident plants the seeds of the next one.
WHAT THIS PROMPT DOES FOR YOUR ORGANISATION
When you paste this prompt into Claude or ChatGPT, it produces a complete Monitoring and Observability Framework — a production-grade technical document that defines your system health targets, alert thresholds, tooling selection, logging architecture, escalation protocols, on-call rotation design, and dashboard structure in a single coherent deliverable your entire engineering team can align on and deploy immediately.
This is the framework that separates reactive engineering teams from proactive ones. Here is exactly what it delivers:
Core Metrics and Service Level Objectives
The framework defines precise, measurable SLOs for every critical system dimension. System uptime is targeted at 99.9 percent annual availability — equivalent to less than 8.7 hours of downtime per year — with a warning threshold at 99.5 percent that triggers investigation before an SLA breach occurs. API latency is targeted at under 200 milliseconds with a warning at 500 milliseconds and a critical threshold at 1 second, because latency degradation is almost always the leading indicator of an outage rather than a consequence of one. Error rate is targeted at under 0.1 percent with escalating warning and critical bands. CPU and memory utilisation thresholds are defined for every tier. Database connection pool saturation and queue depth for asynchronous processors are included — two of the most commonly overlooked metrics that routinely cause production incidents that appear to have no obvious cause.
Tooling Selection by Budget Tier
This is one of the most practically valuable sections of the framework because it removes the most common barrier African engineering teams face when trying to implement observability: the assumption that professional-grade monitoring requires a professional-grade budget.
The open-source tier — Prometheus, Grafana, and Alertmanager — costs zero cedis per month and provides monitoring capabilities that rival commercial solutions costing hundreds of dollars per month. The mid-market tier — New Relic or Datadog at the free tier level — provides managed monitoring with reduced operational overhead for teams that cannot dedicate an engineer to maintaining their own monitoring infrastructure. The enterprise tier — full Datadog, Splunk, or Dynatrace — is specified with the use cases that justify the investment, so engineering leaders can make the right decision for their organisation's stage rather than defaulting to either extreme.
Logging System Architecture
The framework defines a structured JSON logging format with correlation IDs — the standard that allows engineers to trace a single user request across multiple microservices in seconds during an incident, rather than spending hours searching through unstructured log files. A three-tier log retention policy covering hot, warm, and cold storage ensures that logs are accessible when needed for incident investigation without generating unnecessary storage costs over time. A search and query interface recommendation completes the logging architecture, giving the team the tools to extract insight from logs rather than simply accumulating them.
Alert Design — Threshold and Anomaly Based
The framework defines two distinct alert types that serve fundamentally different purposes and should never be conflated. Threshold-based alerts fire when a metric crosses a defined static boundary — the error rate exceeds 0.5 percent, the API latency exceeds 500 milliseconds. These are appropriate for metrics with well-understood normal ranges. Anomaly-based alerts use machine learning to detect deviations from an established baseline — traffic patterns that are unusual for the time of day, request volumes that deviate significantly from historical norms. These are appropriate for the complex, context-dependent signals that threshold alerts miss entirely. Teams that use only threshold alerting routinely experience alert fatigue — too many false positives — while also missing genuine anomalies that do not cross any defined threshold until they have already caused an incident.
Escalation Protocol by Severity
The framework defines four escalation levels with documented response SLAs. P1 critical incidents require an immediate response with a 5-minute SLA — the definition of what constitutes a P1 is specified precisely so that on-call engineers do not have to make that judgement call at 2 in the morning. P2 high-severity incidents carry a 30-minute response SLA. P3 medium-severity incidents are addressed the next business day. Each level defines who is contacted, through which channel, in which order, and what the expected first action is. An on-call rotation template sized for your engineering team is included — because sustainable on-call practices are not just a quality-of-life concern for engineers. They are a retention strategy in a market where experienced DevOps engineers are scarce and increasingly sought by international remote employers.
Dashboard Structure
Four distinct dashboard views are defined to serve the different audiences who need visibility into system health. The executive dashboard shows uptime, infrastructure cost, and incident summary — the three metrics a CEO or board needs without the technical complexity that obscures the story. The engineering dashboard shows all technical metrics in full detail for the team actively managing the systems. The on-call dashboard shows current active alerts and recent incident timeline for the engineer who is responsible right now and needs to make decisions under pressure. The customer impact dashboard shows only user-facing error rates — isolating the signal that determines whether the end-user experience is degraded and whether customer communications are necessary.
WHO NEEDS THIS FRAMEWORK RIGHT NOW
DevOps Engineers and Site Reliability Engineers who are currently managing monitoring configurations that were built quickly and have never been properly documented, standardised, or reviewed as the system scaled.
Platform and Infrastructure Teams at companies where the monitoring setup is understood by one or two engineers and exists nowhere in writing — meaning every incident response depends on institutional knowledge that leaves with each person who moves on.
CTOs and Engineering Managers at scaling companies who know their observability posture is insufficient but have not had the time or structure to address it comprehensively.
Fintech, E-commerce, and Health Tech Companies in Africa where system reliability is directly tied to regulatory standing, customer trust, and revenue — and where an undocumented, ad-hoc incident response process is an existential risk.
SaaS Founders whose products have grown to the point where a production incident now affects real, paying customers and the old approach of investigating manually after a customer complaint is no longer acceptable.
Digital Agencies and Technology Consultancies who manage production systems for clients and need a professional, documented observability framework as part of their service delivery and managed services offering.
If any of the following is true for your organisation, this framework is not optional:
Your team finds out about production incidents from customers before your own monitoring alerts fire.
Your current alerting produces so many false positives that engineers have begun ignoring alerts — the most dangerous monitoring failure mode of all.
You have no documented on-call rotation and incidents are handled by whoever happens to be available, creating burnout and inconsistent response quality.
You have grown from a small team where everyone knew everything to a larger team where incident knowledge is siloed — and that silo creates dangerous single points of failure in your operations.
You are preparing for SOC 2, ISO 27001, or any other compliance framework that requires documented monitoring and incident response procedures.
You have experienced a production incident in the past 12 months that took longer than one hour to resolve — and that duration was partly due to the absence of the right monitoring data at the moment the incident began.
HOW IT WORKS IN THREE STEPS
Step 1. Purchase and download the prompt PDF — instant delivery on Selar.
Step 2. Open Claude at claude.ai or ChatGPT at chat.openai.com — both free to start.
Step 3. Copy and paste the prompt. Add your current technology stack and your engineering team size. Hit send.
Within minutes you have a complete Monitoring and Observability Framework that a specialist DevOps consultancy or SRE advisory firm would charge you GHS 10,000 to GHS 30,000 to design and document — with metric definitions, tooling recommendations, alert design, escalation protocol, and dashboard structure all included in a single professional output.
WHAT YOU RECEIVE INSIDE THE PDF
The complete, upgraded DevOps and Observability Command Centre prompt — copy and paste ready for immediate use.
Step-by-step instructions including technology stack and team size customisation guide.
A clear explanation of who this framework is built for and where it delivers the highest operational return.
Five key benefits explained in detail with African fintech and digital business context.
Claude and ChatGPT tips for generating Prometheus alerting rules in YAML format directly from the framework output — deployable monitoring configuration files your DevOps team can implement without additional specification work.
Full pricing guide for the complete 10-prompt Africa-Proof Tech Stack System.
THE AI TOOLS YOU WILL USE
This prompt is fully optimised for Claude by Anthropic and ChatGPT-4 by OpenAI. Both are available free at the basic tier. For technical infrastructure frameworks that require precise metric definitions, tiered tooling recommendations, and multi-audience dashboard specifications in a single coherent document, Claude is particularly strong — its structured output reads like a professional SRE playbook your engineering team, operations leadership, and compliance auditors can all reference from the same document.
PRICE: GHS 1,027
Consider what a single unmonitored production incident costs your organisation.
For e-commerce businesses, Gartner documents losses of GHS 800,000 to GHS 1.6 million per hour of downtime at current exchange rates. For fintech platforms, API downtime averaged over GHS 2.4 billion in annual losses across the financial services sector globally in 2025. For your business specifically — whatever your hourly revenue is, multiply it by the number of hours your last incident lasted, then add the engineering time spent on reactive response, the customer support overhead, and the trust repair cost with the customers who experienced the failure.
That number is what the absence of a proper observability framework costs you per incident.
The State of Resilience 2025 found that organisations experience an average of 86 outages annually. Even at the most conservative cost estimate — GHS 15,000 per incident for a small African digital business — that is GHS 1.29 million per year in preventable losses.
This prompt costs GHS 1,027. Once.
It produces the framework that catches issues before they become incidents, resolves incidents before they become outages, and documents your entire observability posture in the format required by investors, compliance auditors, and the board members who are increasingly asking about your system reliability before approving technology budgets.
One purchase. One framework. Unlimited use across every system, every client, and every platform you build and manage.
INSTANT DIGITAL DELIVERY
Payment confirmed on Selar means your PDF downloads immediately. No consultant briefing. No engagement letter. No project scoping call. The framework your engineering team needs is available the moment your payment is confirmed.
100 PERCENT SATISFACTION GUARANTEE
Follow the instructions, run the prompt in Claude or ChatGPT, and if the output does not give you a complete, production-ready Monitoring and Observability Framework your DevOps team can deploy immediately — contact us within 7 days for a full refund. No questions asked.
THE COMPLETE SYSTEM
This is Prompt Number 10 of 10 — the final piece of the Africa-Proof Tech Stack System. The complete suite covers technical debt auditing, cloud cost reduction, mobile UX, cybersecurity hardening, open-source AI integration, power resilience, API architecture, tech talent vetting, and boardroom pitching.
Full Toolkit — all 10 prompts: GHS 5,514.
Every technology infrastructure and leadership tool your organisation needs. One investment. Unlimited use across every business, client, and system you build on this continent.
Created by Aderemi Francis — Ecommerce and Digital Services Africa-Proof Tech Stack System — Professional Prompt Series — 2026
Copyright 2026 Aderemi Francis. All rights reserved. For personal and commercial business use.