External Access
Data Analyst Accelerator

(0 Ratings)
1
$200.00$300
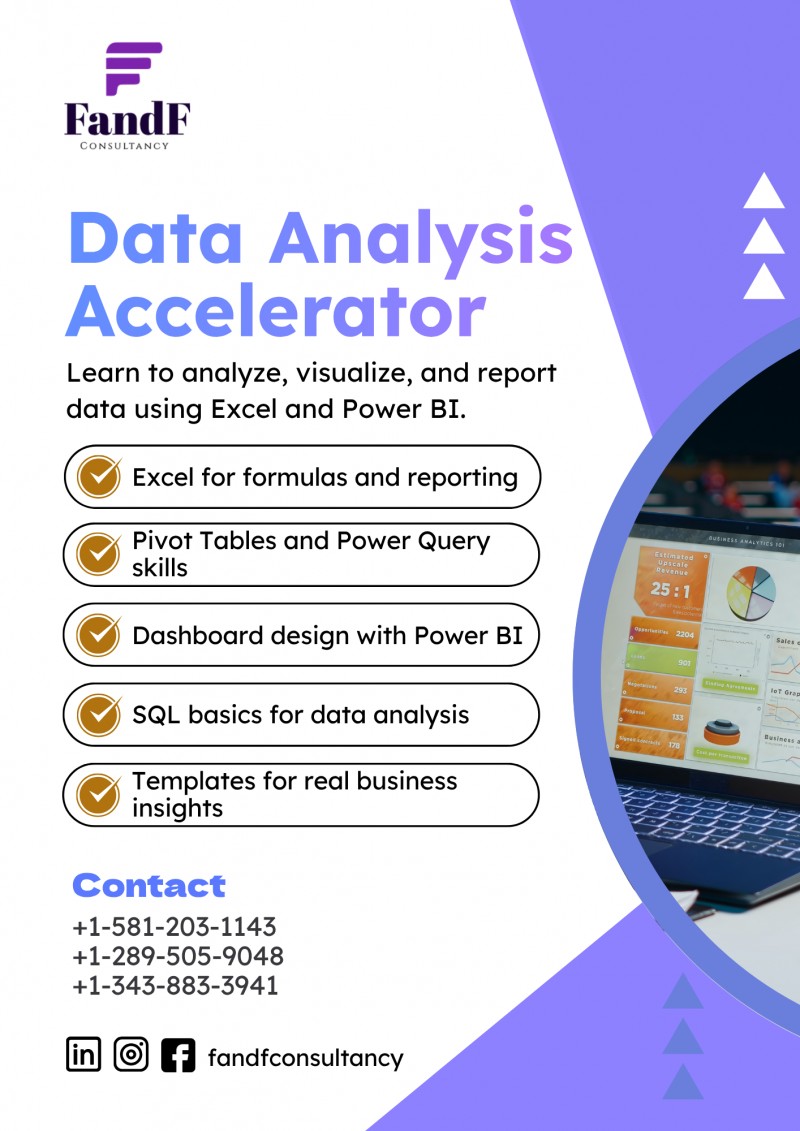
Master business reporting and dashboard design with Excel and Power BI — even if you're not a data expert.
This 4-week self-paced course gives you the technical skills, templates, and hands-on practice you need to deliver real insights to clients or employers.
Duration: 4 Weeks | Self-Paced | Optional Bonus Add-On
For: Aspiring Virtual Assistants serious about building a full-time income or side hustle
Goal: Build end-to-end skills in Excel reporting, dashboards, and Power BI — and walk away with a job-ready portfolio
Format: 4 Weekly Modules | 3–5 hours/week | Practice Projects + Templates
👩💻 Who Should Join the Data Analyst Accelerator?
This program is perfect if you're:
- A VA or freelancer supporting business clients
- An admin, coordinator, or early professional looking to level up
- New to Excel and data tools, but ready to learn by doing
- Looking to build a remote-friendly, in-demand skill set
📚 What You’ll Learn
Week 1: Excel Foundations for Reporting
- Excel navigation, layout, and power shortcuts
- Functions like
SUMIFS,COUNTIFS,IF,TEXT,CONCAT - Table formatting, dropdowns, freeze panes, conditional formatting
Week 2: Pivot Tables & Power Query
- Build summary views using Pivot Tables
- Add slicers, filters, and custom groupings
- Import, clean, and combine raw data with Power Query
Week 3: Dashboard Design & Storytelling in Excel
- Build a 1-page dashboard with dropdowns, KPIs, and charts
- Apply visual hierarchy, color strategy, and layout logic
- Export to PDF, email format, or print-friendly views
Week 4: Power BI for Visual Analytics
- Understand what Power BI is and when to use it
- Connect Excel data to Power BI and build visuals
- Add interactivity: slicers, bar/line charts, filters
- Publish dashboards to the cloud or share with a team
🎁 Bonus Add-On (Optional): Intro to SQL for Beginners
Get a taste of working with databases and structured queries:
- What is SQL and where it fits into reporting
- Simple queries:
SELECT,WHERE,ORDER BY
🎁 Advanced Toolkit
- Pre-built dashboard and KPI templates
- Excel cheat sheets + shortcut guides
- Raw data sets for reporting practice
- Format guides: Admin, Finance, Marketing
- Private feedback session or project review
✅ What You’ll Walk Away With
- A professional Excel dashboard project
- A live Power BI report or portfolio demo
- Resume-ready portfolio samples
- Downloadable templates for continued growth
❓ Frequently Asked Questions
- Do I need Excel experience? Basic familiarity helps, but we walk you through every skill from scratch.
- Will I need Power BI installed? No! You can use Power BI online (free version). All steps are included.
- Is this self-paced or live? This is 100% self-paced. You’ll get clear instructions, videos, and checklists to guide your weekly goals.
- What’s the bonus SQL module for? It gives you a head start on understanding databases — useful for anyone exploring data, analytics, or future roles.
- Is there a certificate? Yes — you’ll receive a branded certificate and badge when you complete all required tasks and submit your final dashboard.