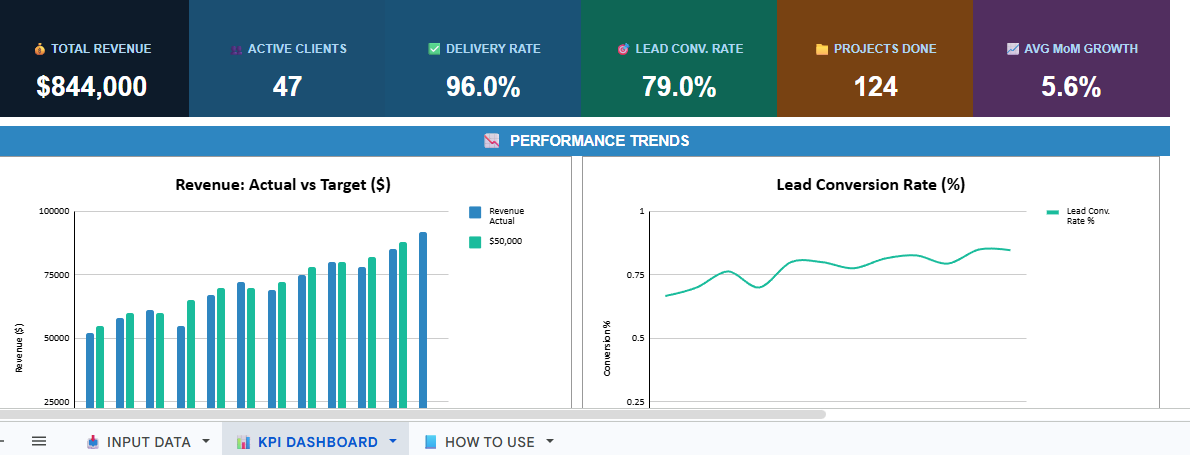
Startup & Agency KPI Dashboard — Excel Template

Stop guessing. Start knowing.
Most startups and agencies are making decisions based on gut feeling not data. This done-for-you Excel KPI Dashboard changes that in minutes. Just open, enter your numbers, and your entire business performance is visualized instantly.
No formulas to build. No design skills needed. No analyst required.
What's Inside:
✅ 6 Live KPI Cards — Total Revenue, Active Clients, Delivery Rate, Lead Conversion Rate, Projects Completed, and Average MoM Growth
📊 4 Dynamic Charts — Revenue Actual vs Target, Lead Conversion Trend, Active Client Growth, and On-Time Delivery Rate
📋 12-Month Summary Table — Every KPI calculated automatically for all 12 months in one clean view
⚙️ Auto-Calculation Engine — MoM Revenue Growth, Client Churn Rate, Project Completion Rate, and Cumulative Revenue all calculated for you
📘 Step-by-Step Instructions — Even a non-technical team member can use this on day one
Who Is This For:
→ Startups tracking growth and investor-ready metrics → Creative and digital agencies managing multiple clients → Freelancers scaling into an agency model → Business owners who want one dashboard instead of scattered spreadsheets
How It Works:
- Download the Excel file
- Open the INPUT DATA sheet
- Replace the sample data with your own monthly figures
- Go to the KPI Dashboard — everything updates instantly
What You Get:
→ 1 fully built Excel file (.xlsx)
→ Works on Microsoft Excel (Windows & Mac)
→ Compatible with Excel 2016, 2019, 2021, and Microsoft 365
→ One-time purchase — yours forever
→ Instant download after payment
Built by a data and dashboard specialist with hands-on experience building financial tracking systems and reporting tools for real businesses.
Questions? Contact: [email protected]