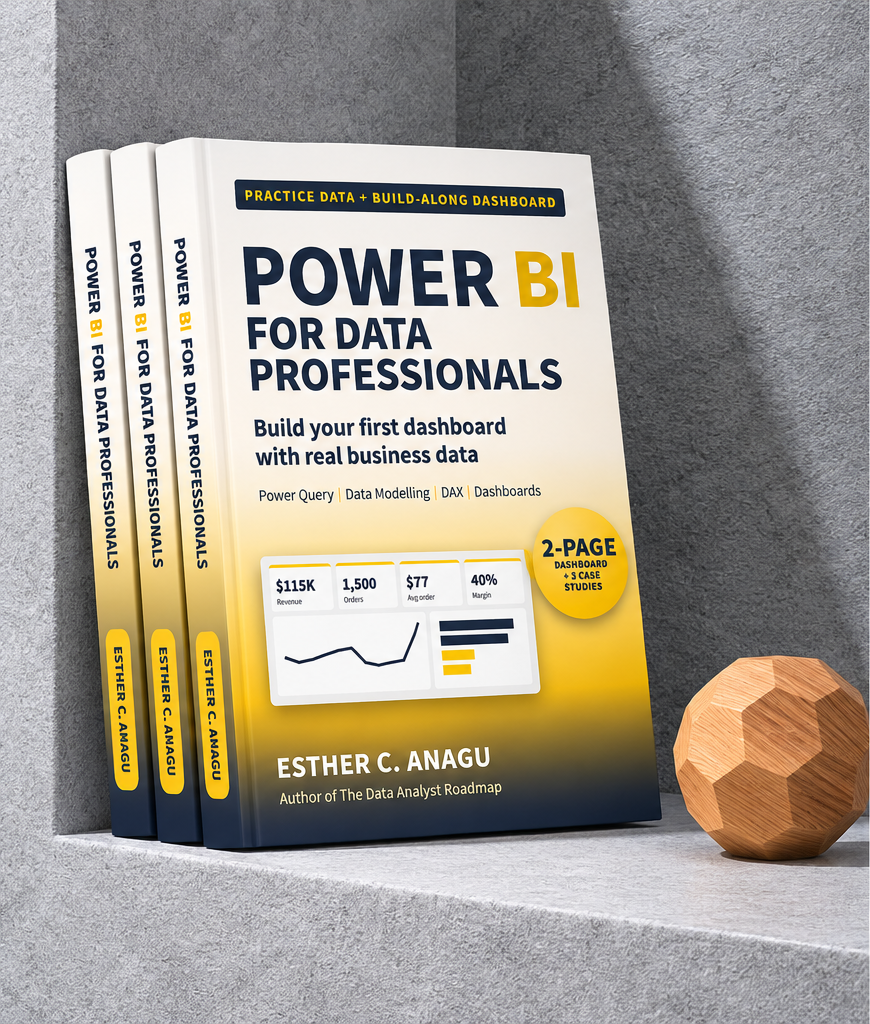
Power BI for Data Professionals: Build Your First Dashboard with Real Business Data

Most Power BI tutorials show you where to click. Then you open your own data and nothing looks like the tutorial. The data is messy, the numbers don’t add up, and you don’t know which chart to use.
This guide takes you from messy raw files to a finished, interactive two-page sales dashboard, step by step, the way analysts build them at work.
What you’ll learn:
- Power Query: clean messy data once, so it cleans itself every time you refresh
- Data modelling: build a star schema, relationships and a proper date table
- DAX from scratch: measures, CALCULATE, % of total, year-to-date and month-over-month growth, with the exact number you should see at every step
- Choosing the right visual: which chart answers which question
- Interactivity: slicers, drill-downs, tooltips and drill-through
- Dashboard design: simple rules that make dashboards easy to understand
- Publishing and sharing: plus how to show your dashboard in your portfolio
Plus:
- Practice questions in every chapter, with full solutions
- 3 real-world case studies: holiday planning, a revenue drop and a profit check
- 10 common Power BI interview questions with model answers
What’s included:
- The full guide (PDF)
- UrbanCart practice data: 1,500 orders, 32 products and a messy customer file to clean
- Every DAX formula in one file, ready to copy
- A printable Dashboard Design Sheet
Who it’s for: beginners and aspiring data analysts who want to build real dashboards, not just watch tutorials.
UrbanCart is the same store used in Excel for Data Professionals and SQL for Data Newbies, so you can answer the same business questions in all three tools.
Written by Esther C. Anagu, ML & AI Engineer and author of The Data Analyst Roadmap and Landing Your First Job as a Data Professional.
Instant download (ZIP). Requires Power BI Desktop, which is free and runs on Windows.