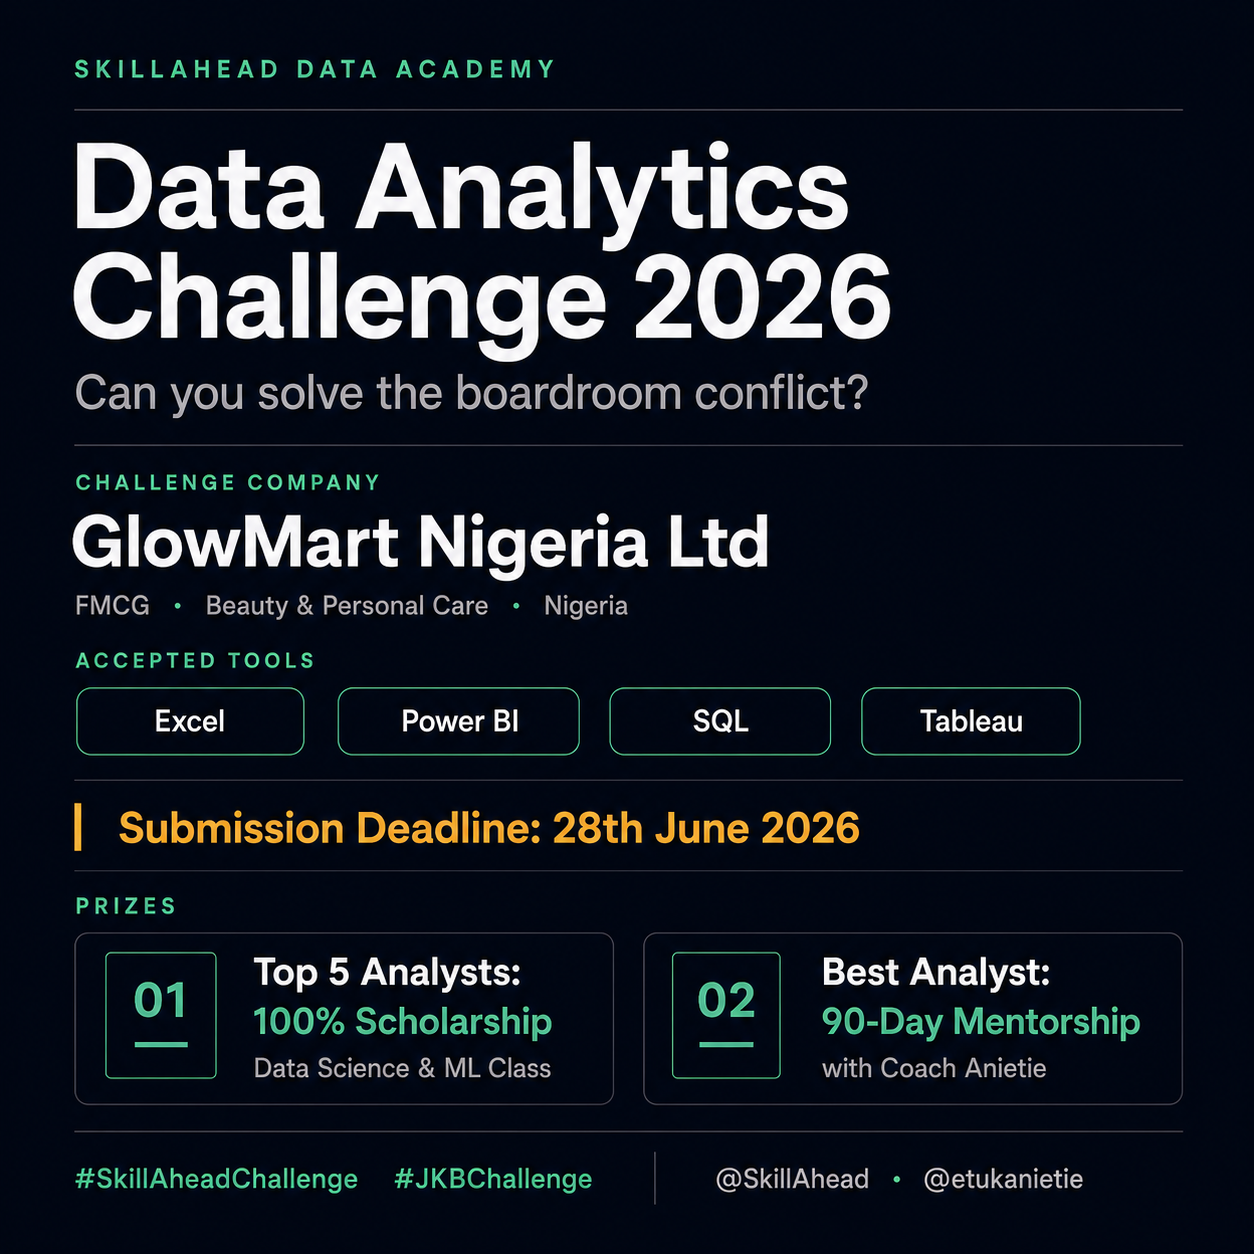
SkillAhead Data Analytics Challenge July 2026

SKILLAHEAD DATA ACADEMY
Data Analytics Challenge July 2026
Official Business Brief & Participant Guide
GlowMart Nigeria Ltd | Sales & Inventory Intelligence | FMCG Beauty & Personal Care
Challenge
SkillAhead Data Analytics Challenge July 2026
Organized by
SkillAhead Data Academy
Industry
FMCG, Beauty & Personal Care Retail
Dataset Period
2022 – 2024 (3 Years)
Submission Deadline
Thursday, 28th June 2026
Coordinator
Coach Anietie | @etukanietie
1. About This Challenge
The SkillAhead Data Analytics Challenge is a real-world, project-based assessment that gives analysts the opportunity to work on a simulated business case modelled after a mid-size FMCG beauty and personal care retail company operating across five Nigerian cities.
Participants will receive a complete business dataset, a business brief describing a real management conflict, and a KPI reference guide. Their task is to build a professional analytics solution, a dashboard or report, that resolves the conflict and answers the business questions using data.
2. The Business Scenario
Company: GlowMart Nigeria Ltd
GlowMart Nigeria Ltd is a mid-size FMCG beauty and personal care retailer with 500 customers, 90 products across 4 brands, and operations in Lagos, Abuja, Kano, Ibadan, and Port Harcourt. The company has recorded 15,000 transactions between 2022 and 2024.
The Conflict
Emeka Okafor (Sales Manager)
"My team is losing sales because Inventory is not stocking the right products in the right cities. Port Harcourt and Kano customers are ready to buy, but the shelves are empty."
Tunde Adeyemi (Inventory Manager)
"I stock based on what Sales tells me to plan for. Nobody gave me updated numbers. My records show equal allocation across all five cities, show me the data."
The MD, Mrs. Chidinma Eze, stepped in and commissioned the Head of BI & Data Analytics to build a single dashboard that resolves this conflict with evidence, and guides future inventory allocation decisions.
3. Dataset Overview
The dataset provided contains four related tables that must be connected in a star-schema data model:ble
Primary KeyoKey Columns
Sales (Fact)
SalesID
All transactions
CustomerID, ProductID, OrderDate, Quantity, Unit Price, Discount, Total Sales
Customers
CustomerID
Who bought
City, Region, Gender, Age Group
Products
ProductID
What was bought
Brand, Cost Price (90 products, 4 brands)
Date
Date
Time intelligence
Year, Month, Quarter, Day of Week
Data covers: 500 customers · 90 products · 4 brands · 5 cities · 15,000 transactions · Price range NGN 1,000 – NGN 20,000 · Discount 0% – 20% · 1 – 5 units per order.
4. Your Task
Using the dataset provided, build a professional analytics solution that:
• Connects the four tables in a correct data model (star schema)
• Calculates the required KPIs and metrics (see Section 5 and the KPI Reference Document)
• Presents the findings in a clean, well-designed dashboard or report
• Resolves the Sales vs. Inventory conflict with data-backed evidence
• Provides at least three business recommendations supported by the analysis
5. Required KPIs & Metrics
Your solution must include, at minimum, the following KPIs. Full formulas and thresholds are provided in the KPI & Metrics Reference Document included in your resource pack.ic
Business Question Answered
Ctegory
01
Total Revenue
How much did GlowMart earn across all cities and brands?
Core Revenue
02
Gross Profit & GP Margin %
Are we making enough profit after cost of goods?
Profitability
03
Total Transactions
How many orders were placed, and is frequency growing?
Volume
04
Avg Order Value (AOV)
How much does a single customer spend per visit?
Efficiency
05
Total Units Sold
How many product units moved across all transactions?
Volume
06
Revenue by City
Which city drives the most revenue, and deserves more stock?
Geographic
07
Revenue by Brand
Which brand is the strongest performer by city?
Brand
08
Total Discount Amount
How much revenue was given away through discounts?
Discount
09
YoY Revenue Growth %
Is the business growing year-on-year?
Growth
10
Transactions per Customer
How frequently do customers return to buy?
Loyalty
11
Revenue per Customer
What is the average 3-year value of one customer?
Customer
6. Resources Provided
Every registered participant will receive the following three resources upon registration confirmation:#
Resource
Description
01
Business Brief
This document, the full scenario, dataset overview, task description, judging criteria, and submission instructions.
02
The Dataset
The GlowMart Nigeria Ltd dataset, an Excel workbook with four sheets: Sales (15,000 rows), Customers, Products, and Date table. Ready for direct import into your analytics tool.
03
KPI & Metrics Reference
A detailed reference document listing all 11 KPIs with their business questions, arithmetic formulas, DAX measures (for Power BI), threshold benchmarks, and the actual dataset values, built to guide your analysis.
7. Eligibility
The SkillAhead Data Analytics Challenge is open to everyone with an interest in data analytics, regardless of educational background or level of experience.
To participate, you must meet the following requirements:
- Submit an original solution to the challenge before the stated deadline.
- Follow the challenge instructions and submission guidelines.
- Share your submission on LinkedIn and include the required challenge hashtags and supporting materials.
- Ensure that all work submitted is your own. Plagiarised or AI-generated submissions presented as original work may be disqualified.
All eligible participants will be considered for official ranking, prizes, scholarships, and other challenge rewards based solely on the quality of their submissions and presentations.
8. Accepted Tools
You may use any of these data analytics tools to complete your project: Tool
Notes
Microsoft Excel
Dashboard using PivotTables, charts, slicers, and formulas. Must include at least one interactive element.
Power BI
Full dashboard with DAX measures, data model relationships, and interactive visuals. Preferred tool.
SQL / MySQL
Queries that produce all required KPIs, plus a written or visual presentation of findings.
Tableau
Interactive dashboard published to Tableau Public. Share the public link in your post.
9. Judging Criteria
All submissions will be evaluated by a panel using the following weighted scoring framework. Total score: 100 points. Criteria
What We Look For
Weight
Insight Quality
Accuracy of KPIs, correct data model, relevant findings that directly answer the business questions.
40 points (40%)
Visual Design & Dashboard
Clean, readable layout; appropriate chart types; consistent colour use; professional presentation.
25 points (25%)
Business Storytelling
Clarity of narrative, conflict resolution with evidence, and quality of business recommendations.
25 points (25%)
Technical Execution
Correct use of tool features: DAX / formulas / SQL / calculated fields as appropriate to the tool used.
10 points (10%)
Tip: The highest-weighted criterion is Insight Quality (40%). Make sure your KPIs are correct, your data model relationships are properly set up, and your analysis directly addresses the Sales vs. Inventory conflict.
10. Prizes & Rewards
Top 5 Analysts
Each of the top 5 ranked analysts will receive a 100% full scholarship to the SkillAhead Data Academy, Data Science and Machine Learning Virtual Class.
Best Analyst, Grand Prize
The #1 ranked analyst will additionally receive a 100% full scholarship to Coach Anietie's next Mentorship Programme, 90 Days of personal coaching, live sessions, and career guidance.
Prize winners will be announced via SkillAhead's official social media channels and contacted directly via LinkedIn within 5 business days after the submission deadline.
11. How to Submit
Submission Deadline: Thursday, 28th June 2026
Late submissions will not be accepted under any circumstances.
Follow these steps exactly to submit your work:
1. Publish your completed project on LinkedIn on or before 28th June 2026.
2. Follow/Connect with SkillAhead and Coach Anietie on LinkedInType
Tag / Handle
https://www.linkedin.com/company/skillahead/urpose
https://www.linkedin.com/in/etukanietie/
3. In your LinkedIn post:
Tag SkillAhead and Coach Anietie
@SkillAhead
@etukanietie
And use these hashtags
#SkillAheadChallenge #JKBChallenge
Makes your post discoverable for the judging panelTy
4. Your submission must be public, set your LinkedIn post visibility to 'Anyone' before posting.
12. Tips for a Winning Submission
• Set up your data model correctly first, all analysis flows from proper relationships between the four tables.
• Start with the conflict resolution angle, the business scenario is your story. Make it clear how your data answers the Sales vs. Inventory debate.
• Use the KPI Reference Document, it gives you the exact formulas, thresholds, and interpretation guidance for all 11 required metrics.
• Design matters, a clean, well-organized dashboard with consistent colours will score higher than a cluttered one, even if the numbers are correct.
• Write at least 3 recommendations, go beyond charts. Tell the MD what GlowMart should do next, and back it with numbers.
• Post early, do not wait until June 19th. Technical issues on deadline day are not grounds for extension.
Questions? Reach out to Coach Anietie on LinkedIn at https://www.linkedin.com/in/etukanietie/ | SkillAhead Data Academy | Data Analytics Challenge 2026