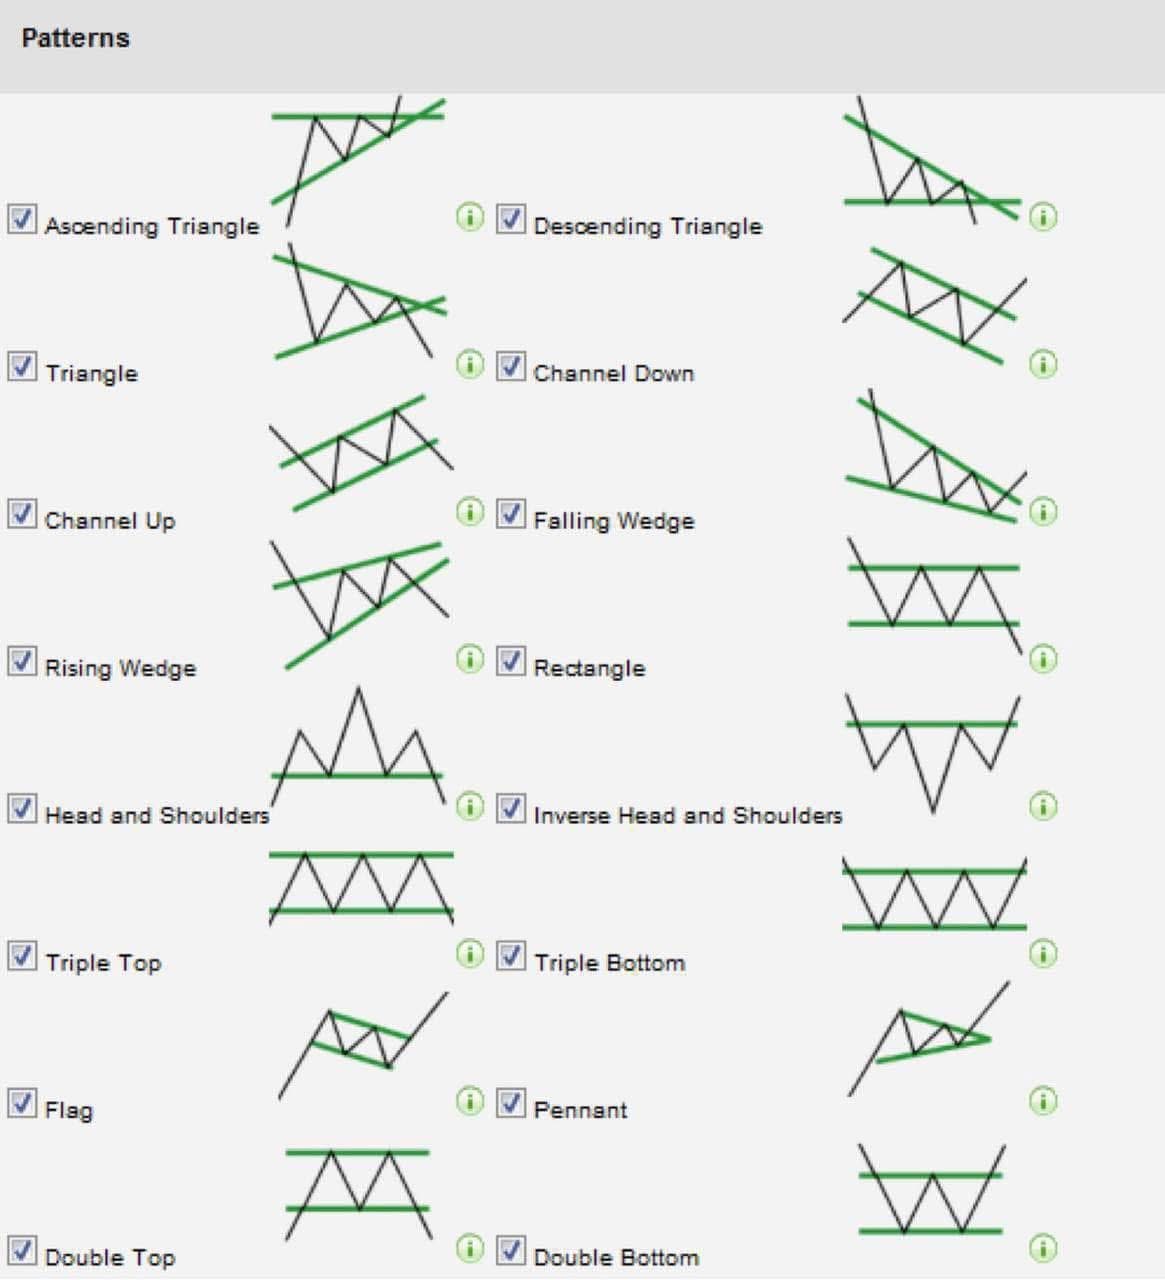
Forex trading structure and forecast trendline

Forex market structure and trend lines are essential tools for analyzing price movements and making informed trading decisions. Here's a brief overview:
1. **Market Structure**: This refers to the arrangement and behavior of buyers (bulls) and sellers (bears) in the market. It helps traders identify trends, reversals, and consolidation phases. Key patterns include:
- **Support and Resistance Levels**: Horizontal lines indicating areas where prices historically reverse or stall.
- **Chart Patterns**: Recognizable shapes like head and shoulders, triangles, and rectangles that signal potential trend changes [A](https://theforexgeek.com/forex-market-structure-patterns/?
2. **Trend Lines**: These are diagonal lines drawn by connecting consecutive highs or lows in an uptrend or downtrend. They help identify the market's direction and potential areas of support and resistance. Breaking a trend line can indicate a trend reversal
If you'd like to dive deeper into these concepts, you can explore resources like [ForexBee](https://forexbee.co/chart-patterns-cheat-sheet/) or [The Forex Geek](https://theforexgeek.com/forex-market-structure-patterns/). Let me know if you'd like tips on drawing trend lines or analyzing specific patterns!