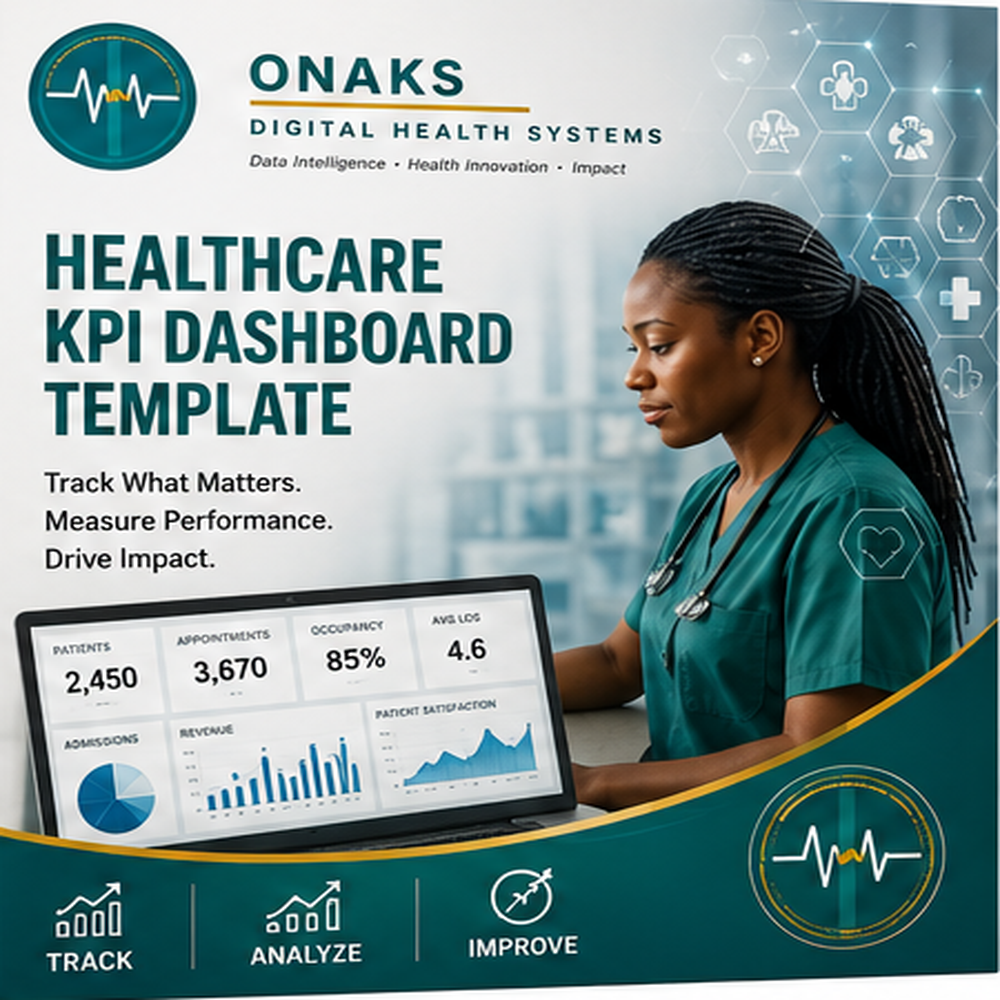
Healthcare KPI Dashboard Template

Know Your Facility's Real Performance
— Before Your Commissioner Does.
A 58-indicator Excel dashboard built on NHMIS 2.0 that gives hospital managers instant RAG-status visibility into clinical performance, NHIA rejection trends, and data quality — all auto-calculated from one monthly input sheet.
Most Nigerian health facility managers only find out they have a performance problem when the SMOH calls. By then, it's already too late.
This KPI dashboard puts 58 NHMIS 2.0 indicators on a single screen — colour-coded Red, Amber, and Green — so you can see exactly where your facility is performing and where it needs attention. The NHIA rejection tracker surfaces your top rejection codes (R-01 to R-08) so you can fix the root cause before they cost you more revenue. The DQA scorecard tells you your data quality score before any audit.
Built from the ground up for Nigerian facility managers — not adapted from a Western hospital template. Every indicator, benchmark, and classification reflects the Nigerian health system context.
• 58-Indicator Performance Dashboard
Auto-populating RAG (Red/Amber/Green) status for every key NHMIS 2.0 indicator — updated instantly when you enter monthly data
• 7 Domain KPI Tabs
OPD efficiency, IPD outcomes, MCH coverage rates, Disease Surveillance, Financial performance, HR metrics, and DQA — all auto-fed from one input sheet
• NHIA Claim Rejection Tracker
Rejection volume by code (R-01 to R-08), month-on-month trend tracking, and estimated revenue impact per rejection category
• DQA Scorecard
Verification Factor calculation, completeness rate, timeliness score, and an overall facility DQA grade — ready before any audit visit
• Results Chain Framework
Every indicator classified by Input, Process, Output, Outcome, and Impact — aligned with M&E best practice and FMOH reporting expectations
• Benchmark Reference Sheet
National and Lagos State performance benchmarks for key indicators — so you know exactly how your facility compares
WHO IT'S FOR
• Medical Directors & CMOs — wanting a monthly performance snapshot before SMOH reviews
• Hospital Administrators — tracking operational, financial, and quality KPIs simultaneously
• M&E Officers — preparing for SMOH performance reviews, DQA visits, and accreditation submissions
• NHIA Desk Officers — managing claim rejection rates and revenue leakage from HMO accounts
• Quality Improvement Teams — running facility performance improvement cycles with data
KEY BENEFITS
✦ See 58 indicators in 60 seconds
The colour-coded RAG dashboard eliminates hours of manual analysis every month — open the file, enter last month's data, see your facility's full picture instantly.
✦ Stop NHIA revenue leakage
The rejection tracker identifies which claim codes are costing your facility the most — and flags them for action before they become a pattern.
✦ Prepare for DQA visits with confidence
The built-in DQA scorecard shows your facility's data quality grade before auditors arrive — no more surprises during site visits.
✦ Align completely with NHMIS 2.0
Every indicator is mapped to the 2024 NHMIS framework — no outdated metrics, no indicators your SMOH doesn't recognise.
✦ Boardroom-ready output
The dashboard produces professional, presentation-ready outputs for commissioner reviews, board meetings, and stakeholder reports.