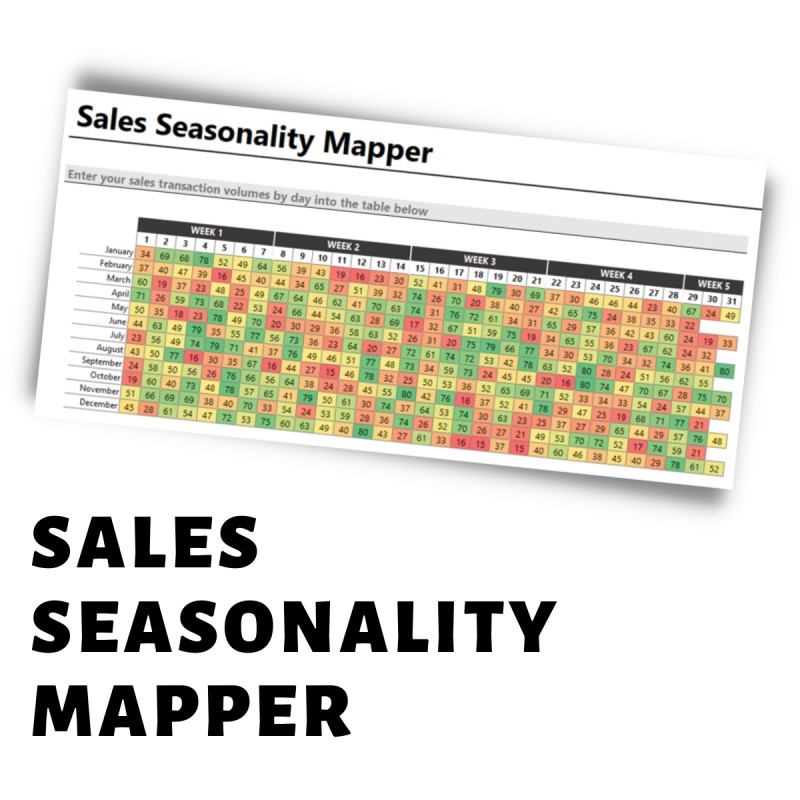
Sales Seasonality Mapper
Uncover insightful trends in your business sales using the Sales Seasonality Mapper.
Use the Sales Seasonality Mapper to keep track of your sales volumes (or transaction volumes) on a daily basis. A heatmap is generated as you input data, and this heatmap creates a color code of the days with higher or lower sales volume than average.
With this information, you can quickly understand seasonality trends relating to your business performance ("Do I make more sales on Tuesdays? Saturdays? Or on the last weeks in the month?") and make better-targeted decisions to drive improved sales performance.
The Sales Seasonality Mapper is easy to use. Simply type in the number of sales you realized per day (or sales revenue, or transaction volume), and the heatmap is automatically generated. Enter 0 for the dates where no sales were recorded.